Designing a Network Manager for a Million Devices
How Cambium’s flagship cloud platform was designed from scratch to make enterprise wireless networks readable, fast and consistent.
- My Role
- Designed the platform end to end as product designer
- Team
- Multiple engineering squads, Product management, NOC and field stakeholders, QA
- Timeline
- 2014 – present, from first release through ongoing platform growth
- Outcome
- One consistent platform across cloud and on-premises deployments
The short version · 30-second read
- The problem
- Operators were juggling separate tools for each product line.
- What I did
- Ran stakeholder discovery with NOC and field teams
- Defined IA, navigation and data visualization patterns
- The result
- Manages 1M+ connected devices worldwide
- 60% less time spent on provisioning
- 45% less dashboard visual fatigue reported by NOC teams
Overview
What is cnMaestro?
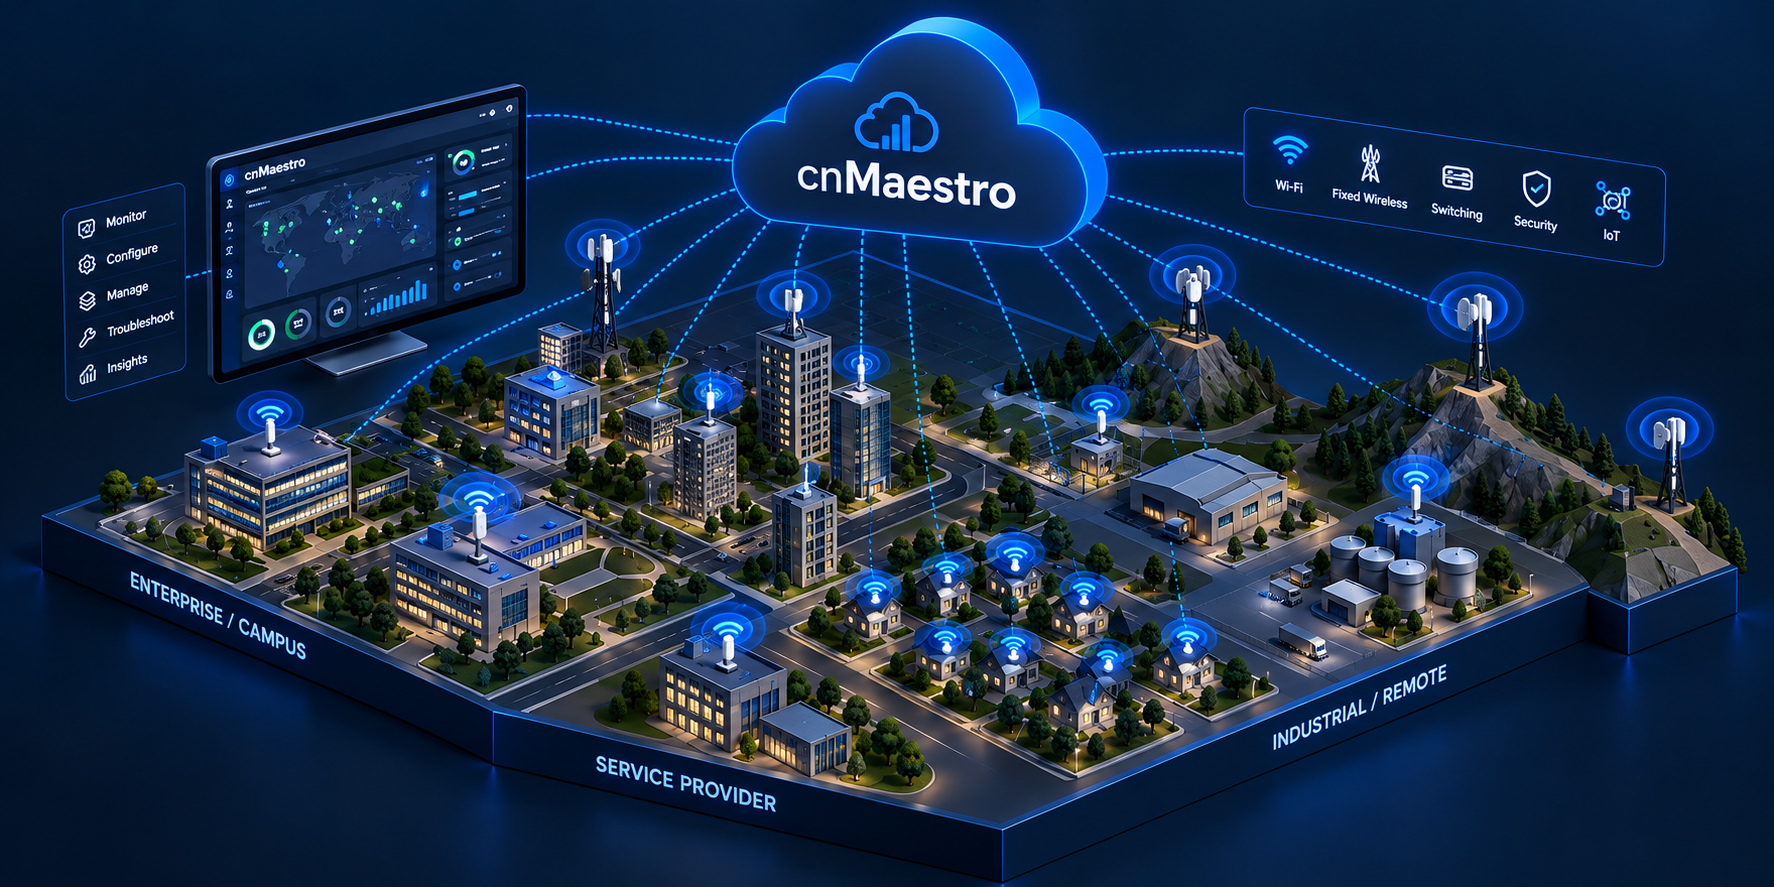
cnMaestro is Cambium’s cloud and on-premises network manager, used by enterprise and ISP operations teams to provision, monitor and troubleshoot 1M+ connected devices.
Why design it from scratch?
Operators were juggling separate tools for each product line. Dashboards were dense with no hierarchy, maps were a sea of dots, and configuring devices one at a time took entire days.
My role
- Designed the platform end to end as product designer
- Ran stakeholder discovery with NOC and field teams
- Defined IA, navigation and data visualization patterns
- Built the Figma variable-based design system
- Created condition-driven prototypes for validation
- Partnered with engineering on build QA
- Team
- Multiple engineering squads
- Product management
- NOC and field stakeholders
- QA
- Outcome
- One consistent platform across cloud and on-premises deployments
Problem & Opportunity
The problem
Enterprise networks are complex, and the tools made it worse. Operators spent more time reading the tool than running the network.
- Dashboards packed in data with no clear hierarchy
- Thousands of links on a map were impossible to scan
- Provisioning happened one device at a time
- Failures were found by customers first
- The same components built differently by each squad
- No shared system across cloud and on-premises
The opportunity
We had the chance to build one platform for every product line. If we got it right, operators would spot problems before their customers did.
- Clear hierarchy in dense NOC views
- Health at a glance on the map
- Bulk workflows for provisioning
- See problems before customers do
- A governed design system for every squad
- Consistency across cloud and on-premises
Discovery & Research
Where we started
The ask from the business sounded simple:
- One console for every product line
- Faster device onboarding
- Modern dashboards
- Cloud and on-premises parity
Underneath was a bigger challenge: operators didn’t trust what the screen told them, and every new feature added another visual dialect. We had to design a platform and the system that keeps it consistent.
What we did to dig deeper
2
Core User Groups
NOC operators and field technicians, with very different needs.
5
Design Phases
Discovery, IA, design system, prototyping and handoff.
2
Deployment Modes
Cloud and on-premises, kept visually identical.
100%
Tokenized UI
Every component bound to design tokens.
NOC Shadowing
Watched operators triage alerts to see which data they actually used.
Condition-Driven Prototypes
Simulated telemetry so stakeholders could test real interactions before code.
What we heard
“I need to know what’s broken before the customer calls.”
“The map is just a sea of dots.”
“Configuring 200 radios one by one is my whole day.”
Insights that changed the brief
Two operator mindsets kept surfacing:
Monitors
They scan for anything abnormal and need to spot trouble without reading every row.
Fixers
They dive into one device or link and need every detail.
Progressive disclosure, summary first, detail on demand, became the platform’s backbone.
Network Monitor
Network Fixer
Insights that shaped the design
No hierarchy
Everything looked equally important, so nothing stood out.
Unreadable maps
Failures were hidden among thousands of healthy links.
Inconsistent squads
The same table behaved differently on every page.
Manual provisioning
Hours lost configuring devices individually.
Design Strategy
More features weren’t the answer. Operators needed to read a huge network clearly, so we wrote down what the platform was for:
North star
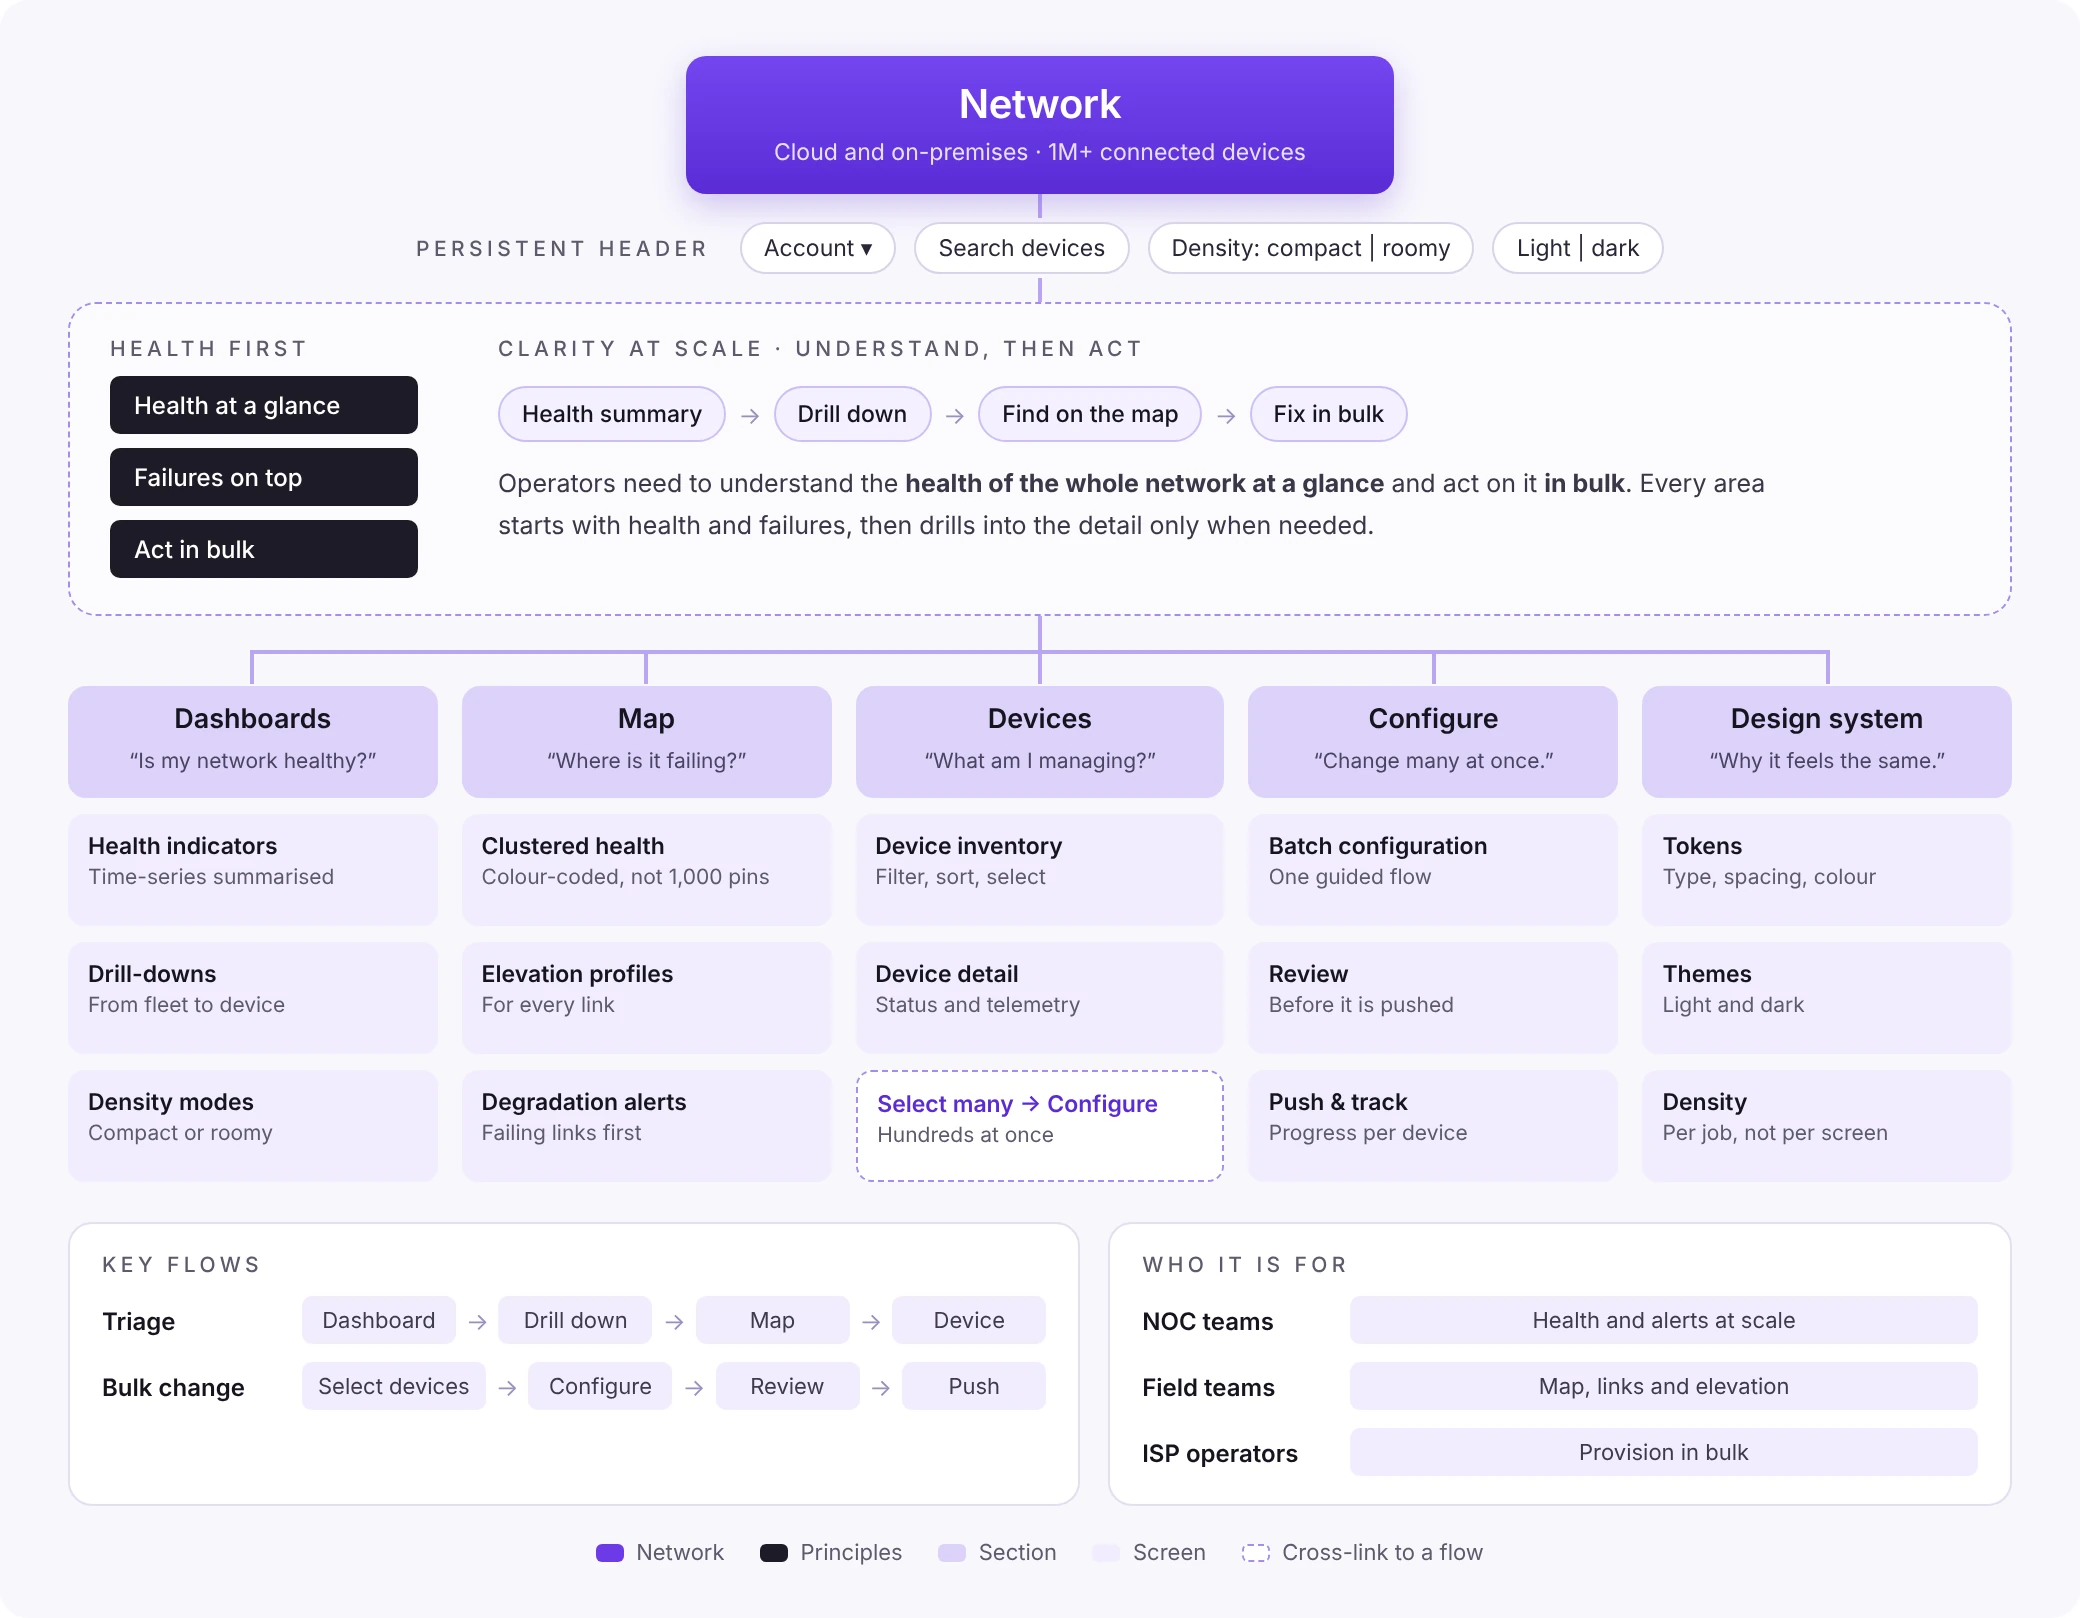
“To let operators understand the health of their whole network at a glance, and act on it in bulk.”
Key pivots
From uniform dense screens
To compact and roomy density modes
Different jobs need different amounts of data.
From thousands of map pins
To clustered, colour-coded health
Failures should be the first thing you see.
From per-squad components
To a living, tokenized design system
Consistency is how a large team ships fast.
Information Architecture
A network manager is usually organised by device type and setting. We organised cnMaestro around the operator’s two jobs: see the health of the whole network quickly, then act on it in bulk.
Design Execution
Figma Variable-Based Design System
Multi-mode tokens control typography, spacing, light/dark themes and density across the whole platform.

Real-Time Telemetry Dashboards
High-volume time-series data is summarised into clear health indicators with drill-downs.

Live GIS Topology
Dynamic clustering, elevation profiles and degradation alerts make failing links instantly findable.

Batch Configuration
Operators select hundreds of devices and push configuration in one guided flow.

Final Design & Outcomes
cnMaestro became one consistent platform for running enterprise wireless at scale.


Outcomes
1M+
devices
60%
faster provisioning
45%
less visual fatigue
4.8/5
CSAT
Testing & Validation
- Validated flows with condition-driven prototypes
- Reviewed builds with engineering for precision
- Collected feedback from enterprise NOC teams
- NOC and field teams used density modes differently
- Clustering removed most “where is it?” moments
- Stakeholders trusted interactive prototypes over static mocks
- Added smarter progressive disclosure
- Tuned clustering thresholds and alert colours
- Exported tokens straight into web components
Looking Back & Forward
Designing a platform this large taught me that the design system is the product’s spine. Without it, every new feature would have pulled the experience apart.
The same foundations now power MarketApps, MDU and the Subscriber app.
- Data overloadClear hierarchy
- One device at a timeBulk operations
- Inconsistent squadsOne governed system